
Residential Zoning by Race - Redlining and Zoning
by Carolyn Ristau

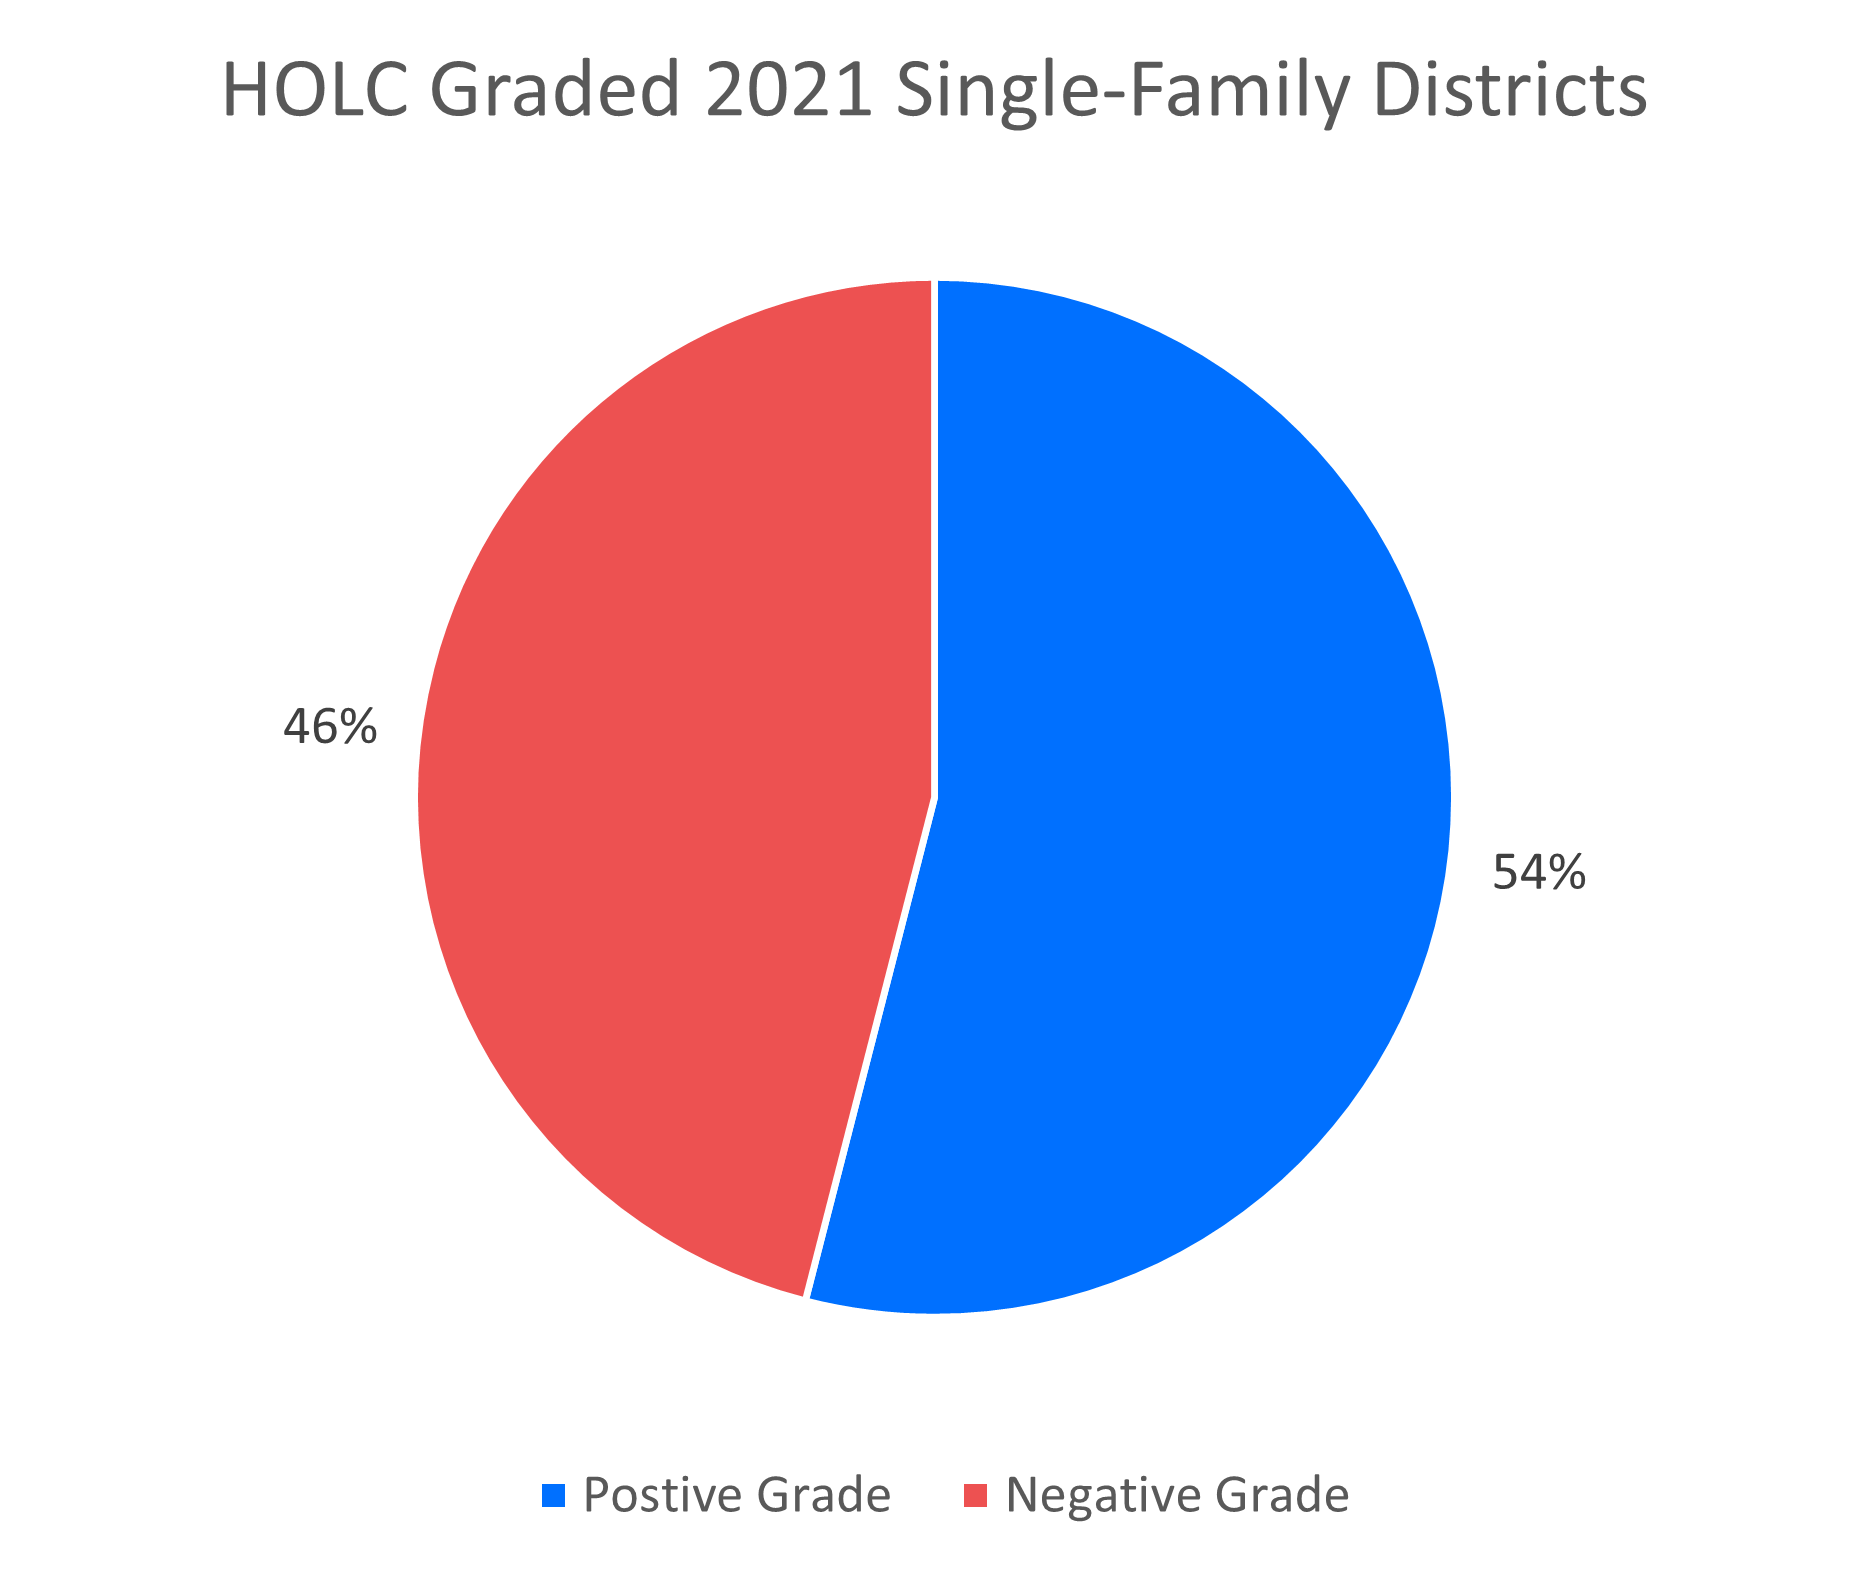
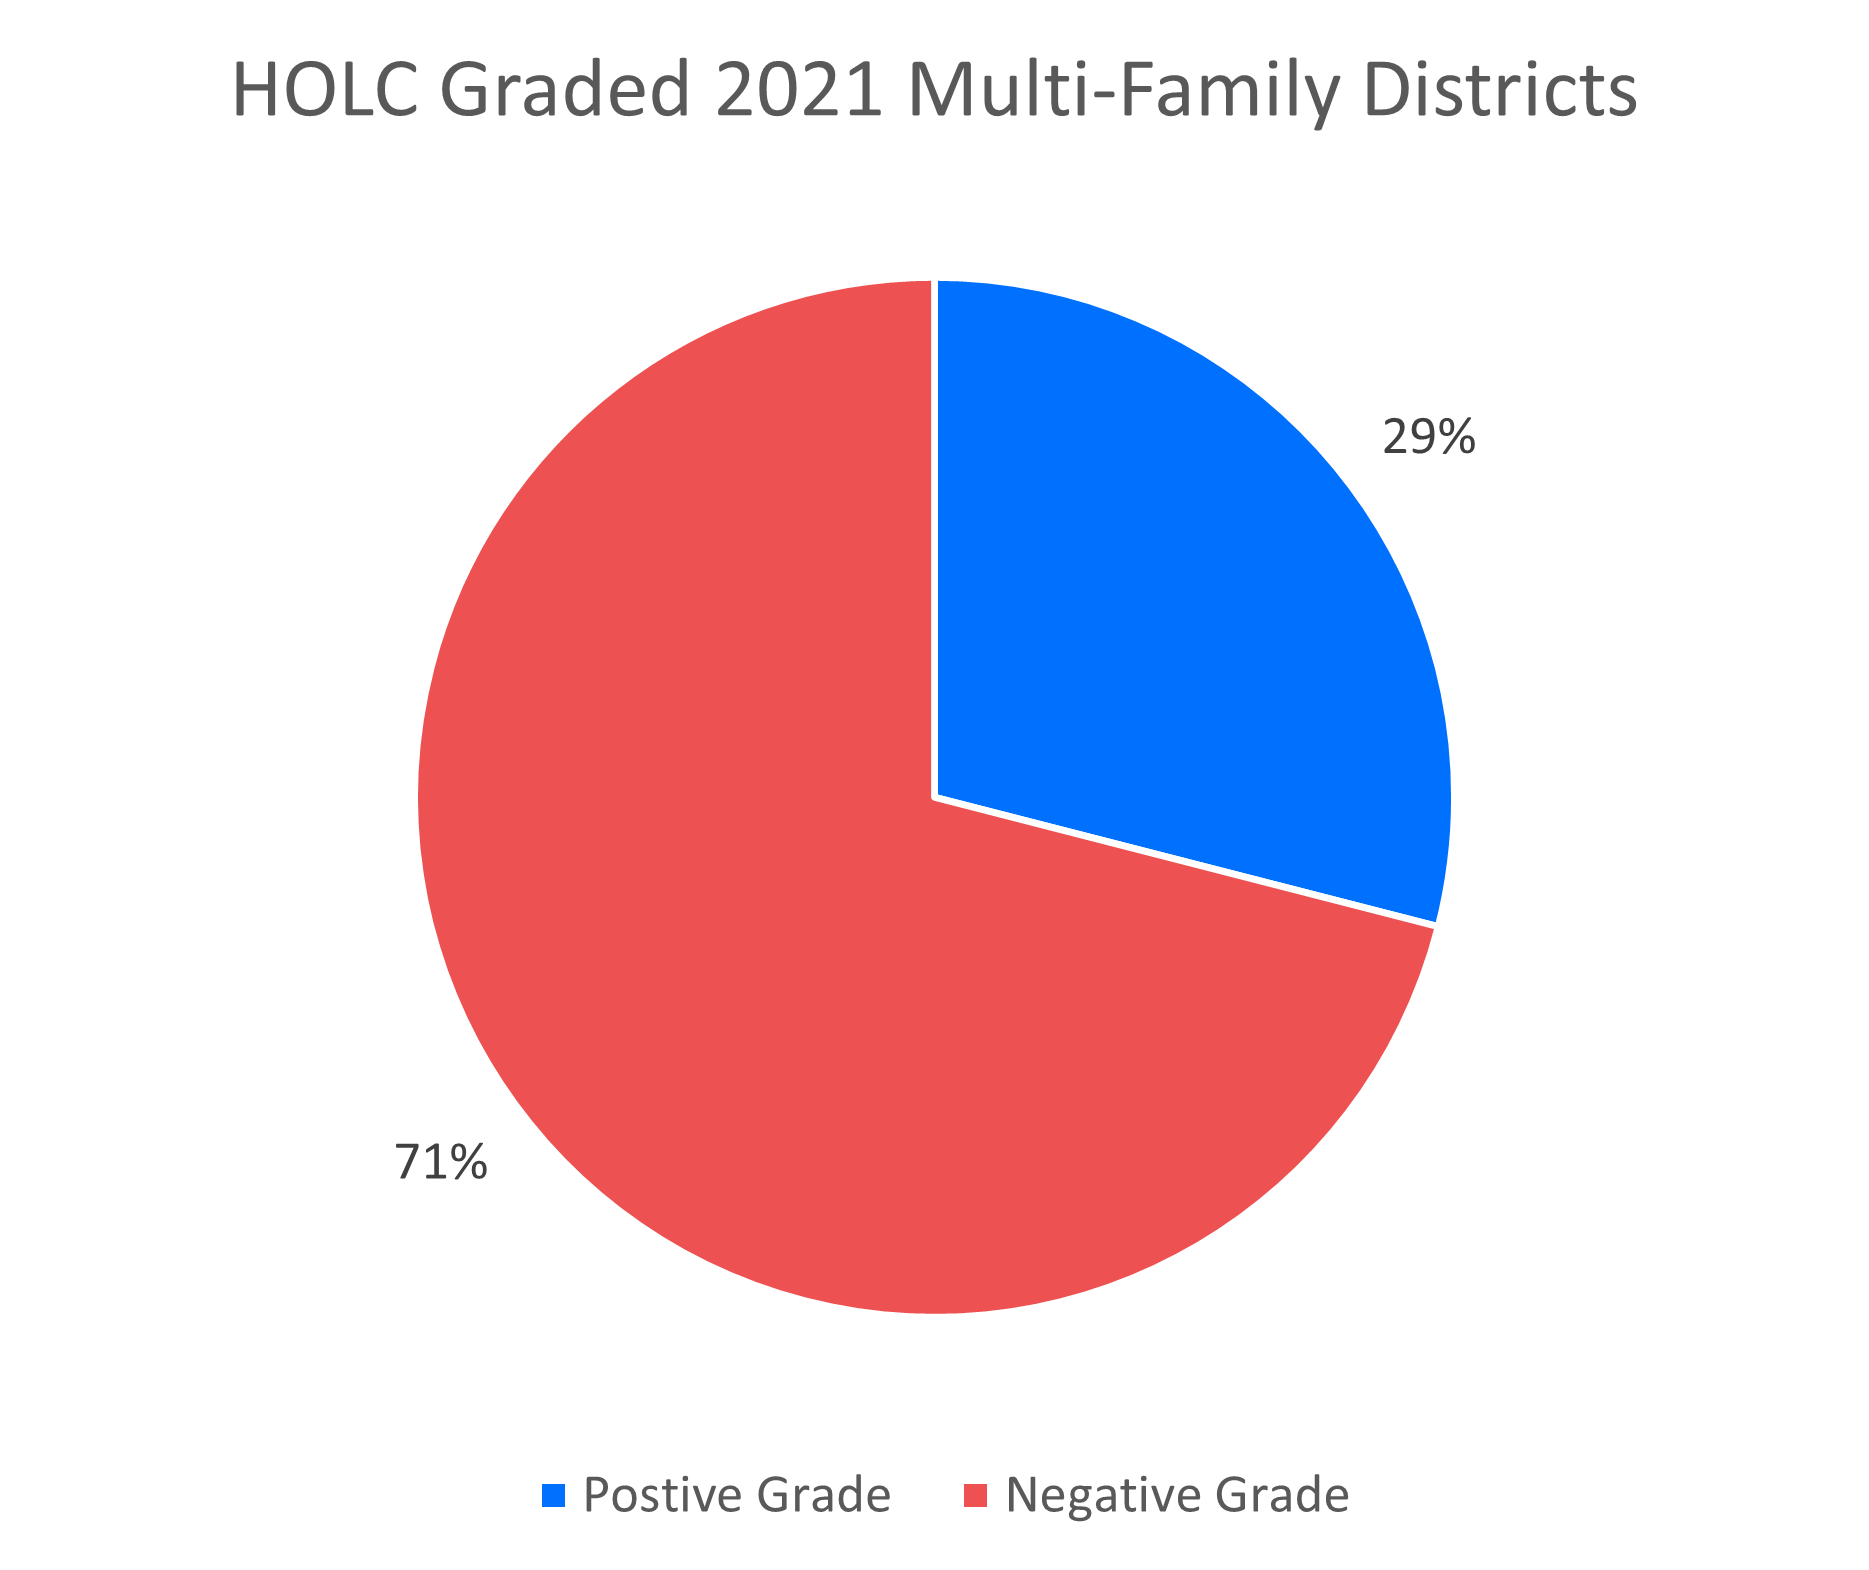
Diving further into the influence of redlining on the locations of residential zoning districts in Pittsburgh, there is a strong correlation between Pittsburgh’s single-unit zoning districts and positively graded areas and between the City’s multi-family zoning districts and negatively graded areas.
The 1937 Home Owner’s Loan Corporation (HOLC) issued its Residential Security Map of Pittsburgh in 1937. On this map, residential areas were graded A, B, C, or D. Areas graded A were considered safest and “best” for investing in mortgages and other housing financing. On the other end of the spectrum, areas graded D were considered “hazardous” for investing in mortgages and other housing financing. D areas were colored red, which led to this practice being nicknamed redlining.
The Fair Housing Act of 1968 made the practice of redlining illegal. The Community Reinvestment Act of 1977 attempted to reverse the impacts of redlining by encouraging banks to invest in their communities, particularly low- and moderate-income neighborhoods. However, the discriminatory approach to housing illustrated by redlining found its way into other policies and practices that still continue today.
In comparing the 1937 redlining map to the 2021 residential zoning districts in Pittsburgh, 54% of the current single-family zoning districts are located in areas that were positively graded by HOLC in 1937, while only 29% of multi-family districts are in areas that were positively graded.
More maps and graphs showing how the correlation between redlining and zoning over the last 100 years in Pittsburgh are available on the main project page.