
Residential Zoning by Race:
How Pittsburgh’s Zoning Districts Promote Different Housing Options for Black and White Residents
Part 7: Case Study and the Factors
by Carolyn Ristau
The Redlining and Race Factors
In the city-wide analysis of single-family and multi-family zoning districts in 1927, 1967, and 2021, this research found the following:
Single-family zoning districts grew significantly across the city
Multi-family zoning districts contracted from 74% to 5% of the city
Multi-family zoning districts in 1927, 1967, and 2021 have a strong correlation with areas graded C “Definitely Declining” and D “Hazardous”
Multi-family zoning districts are increasingly concentrated in areas without a supermajority of White residents
The Homewood and Point Breeze neighborhoods of our case study support these findings.

Single-Family Zoning Districts 1927-2021
Single-family zoning district grew across the city from 1927 to 2021. In the Homewood and Point Breeze neighborhoods, the single-family zoning districts also grew, but most of that growth happened on the Point Breeze side of the tracks.
-

1927 Single-Family Zoning Districts
-
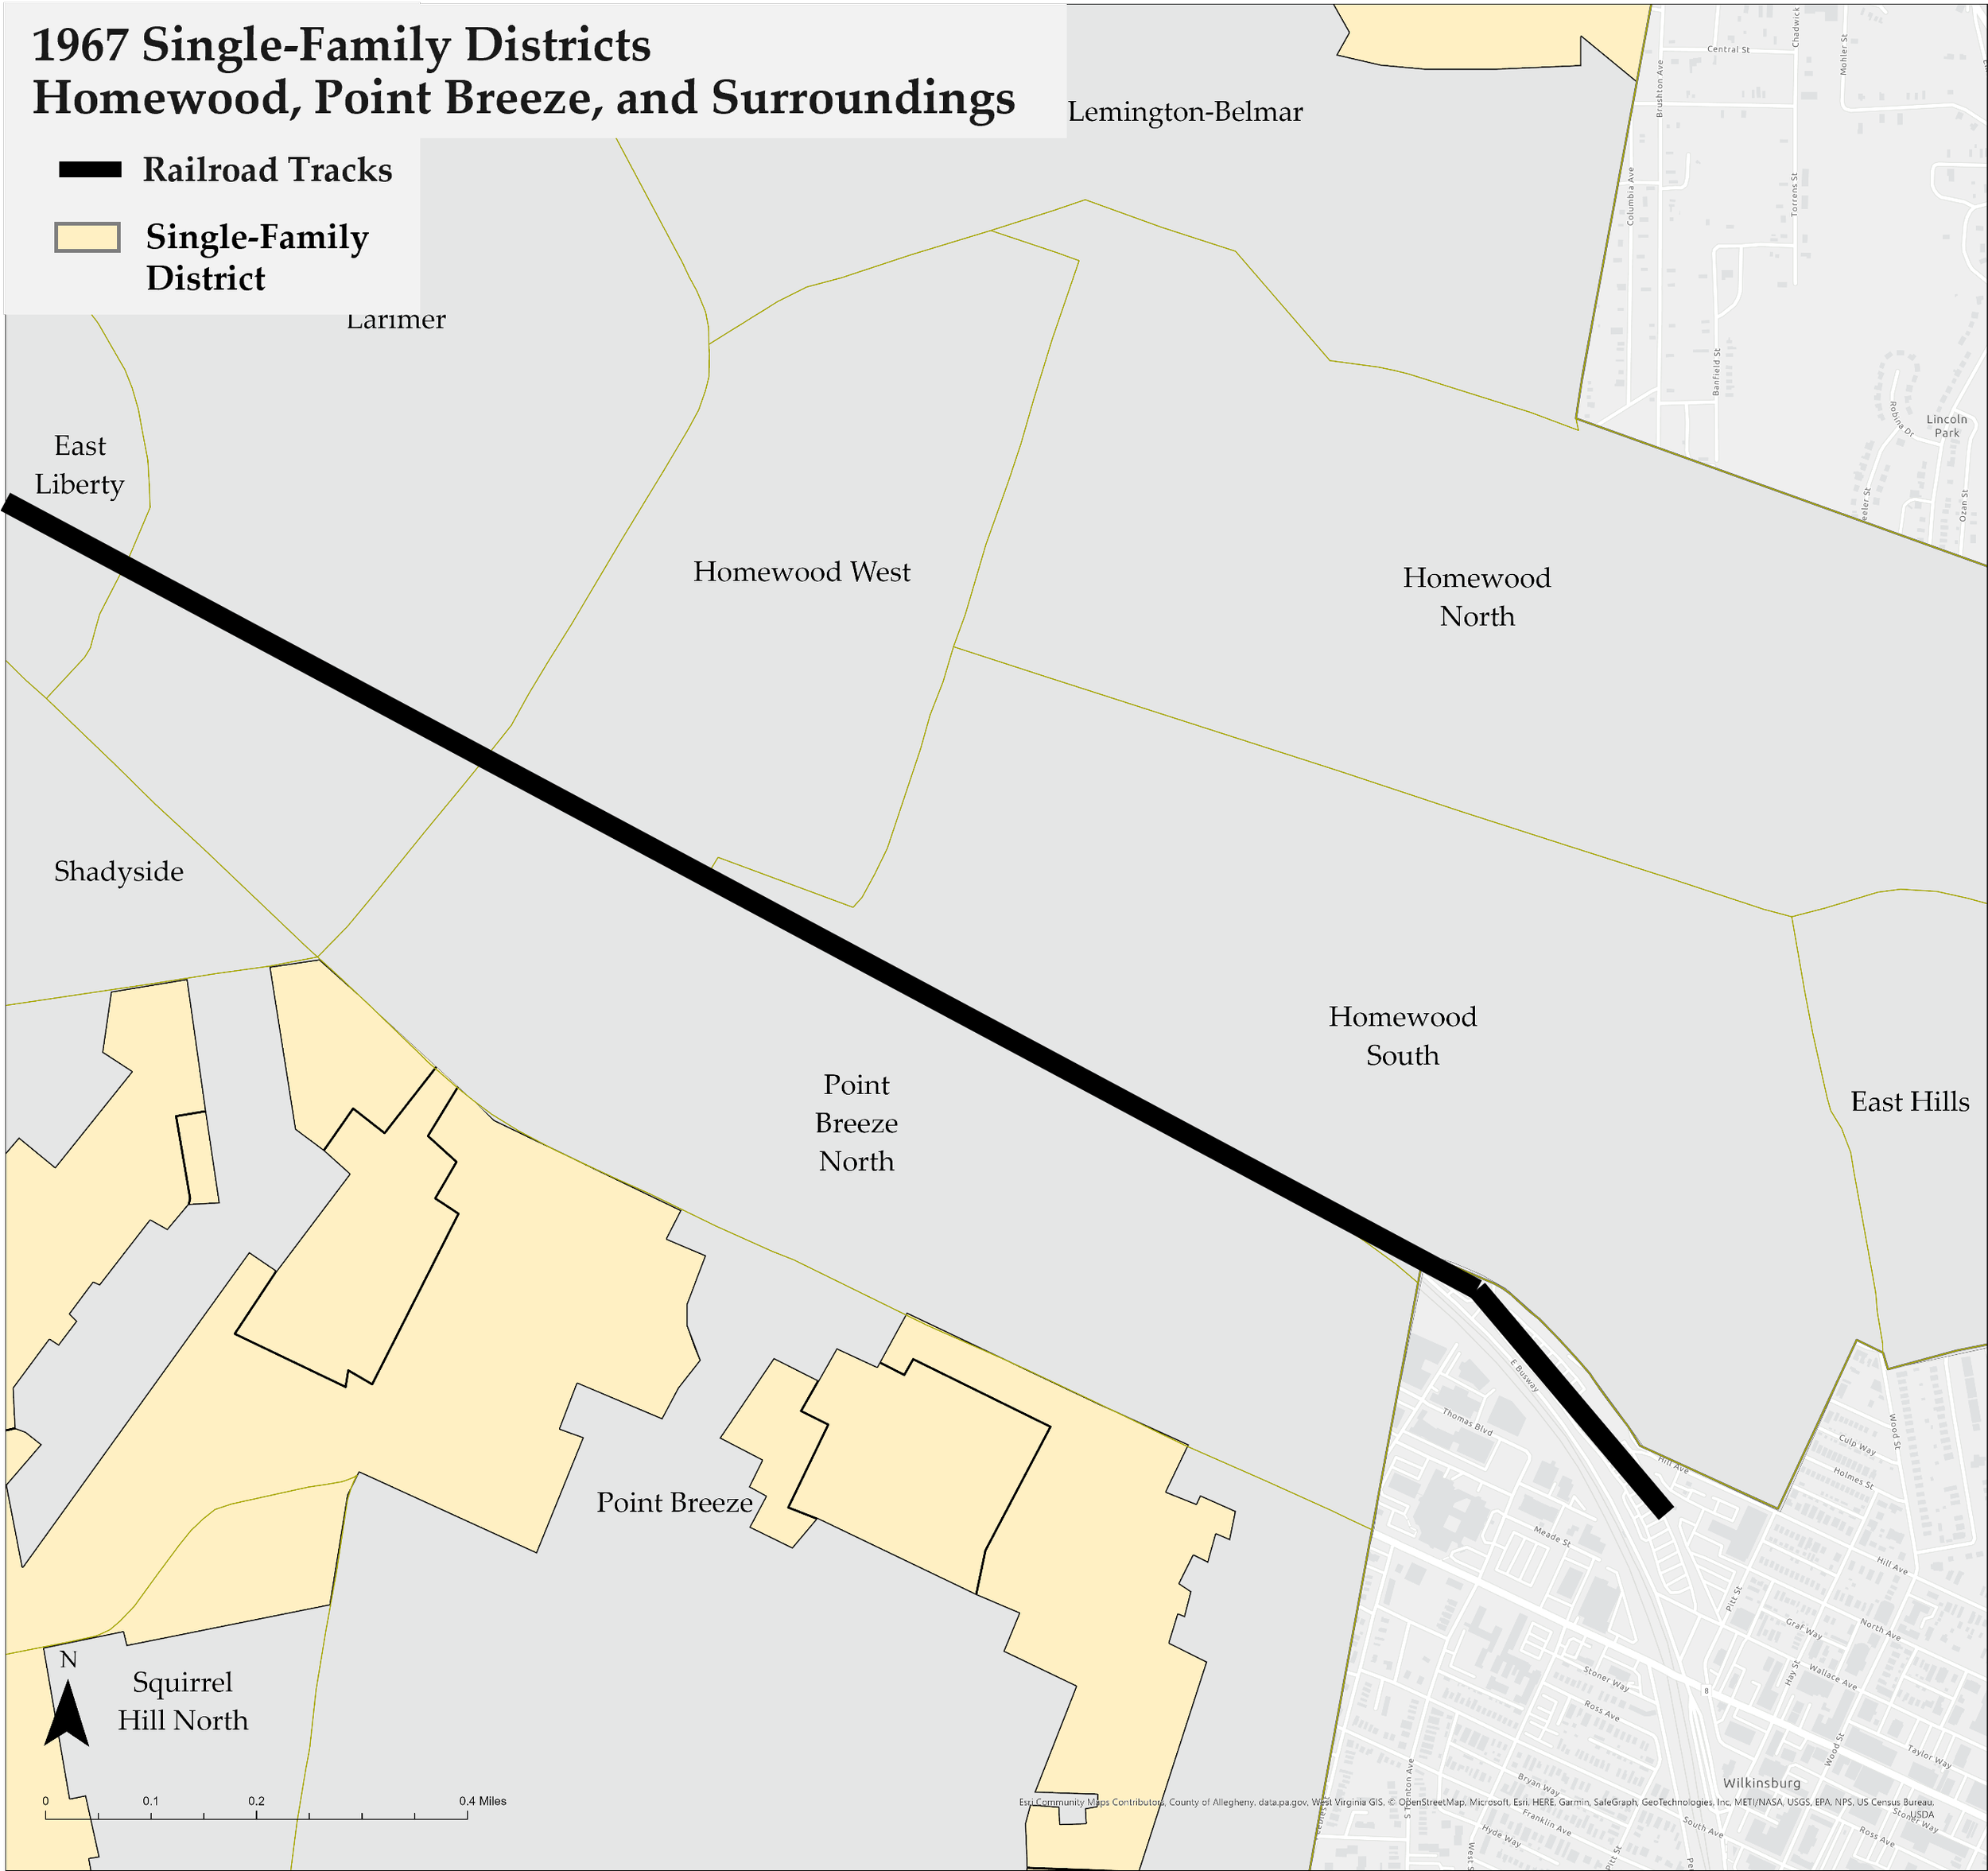
1967 Single-Family Zoning Districts
-

2021 Single-Family Zoning Districts
Multi-Family Zoning Districts 1927-2021
Multi-family zoning districts contracted across the city from 1927 to 2021. In the Homewood and Point Breeze neighborhoods, the multi-family zoning districts also contracted, nearly disappearing from the Point Breeze side of the railroad tracks. However, a significant amount of multi-family zoning districts remains on the Homewood side.
-

1927 Multi-Family Zoning Districts
-

1967 Multi-Family Zoning Districts
-
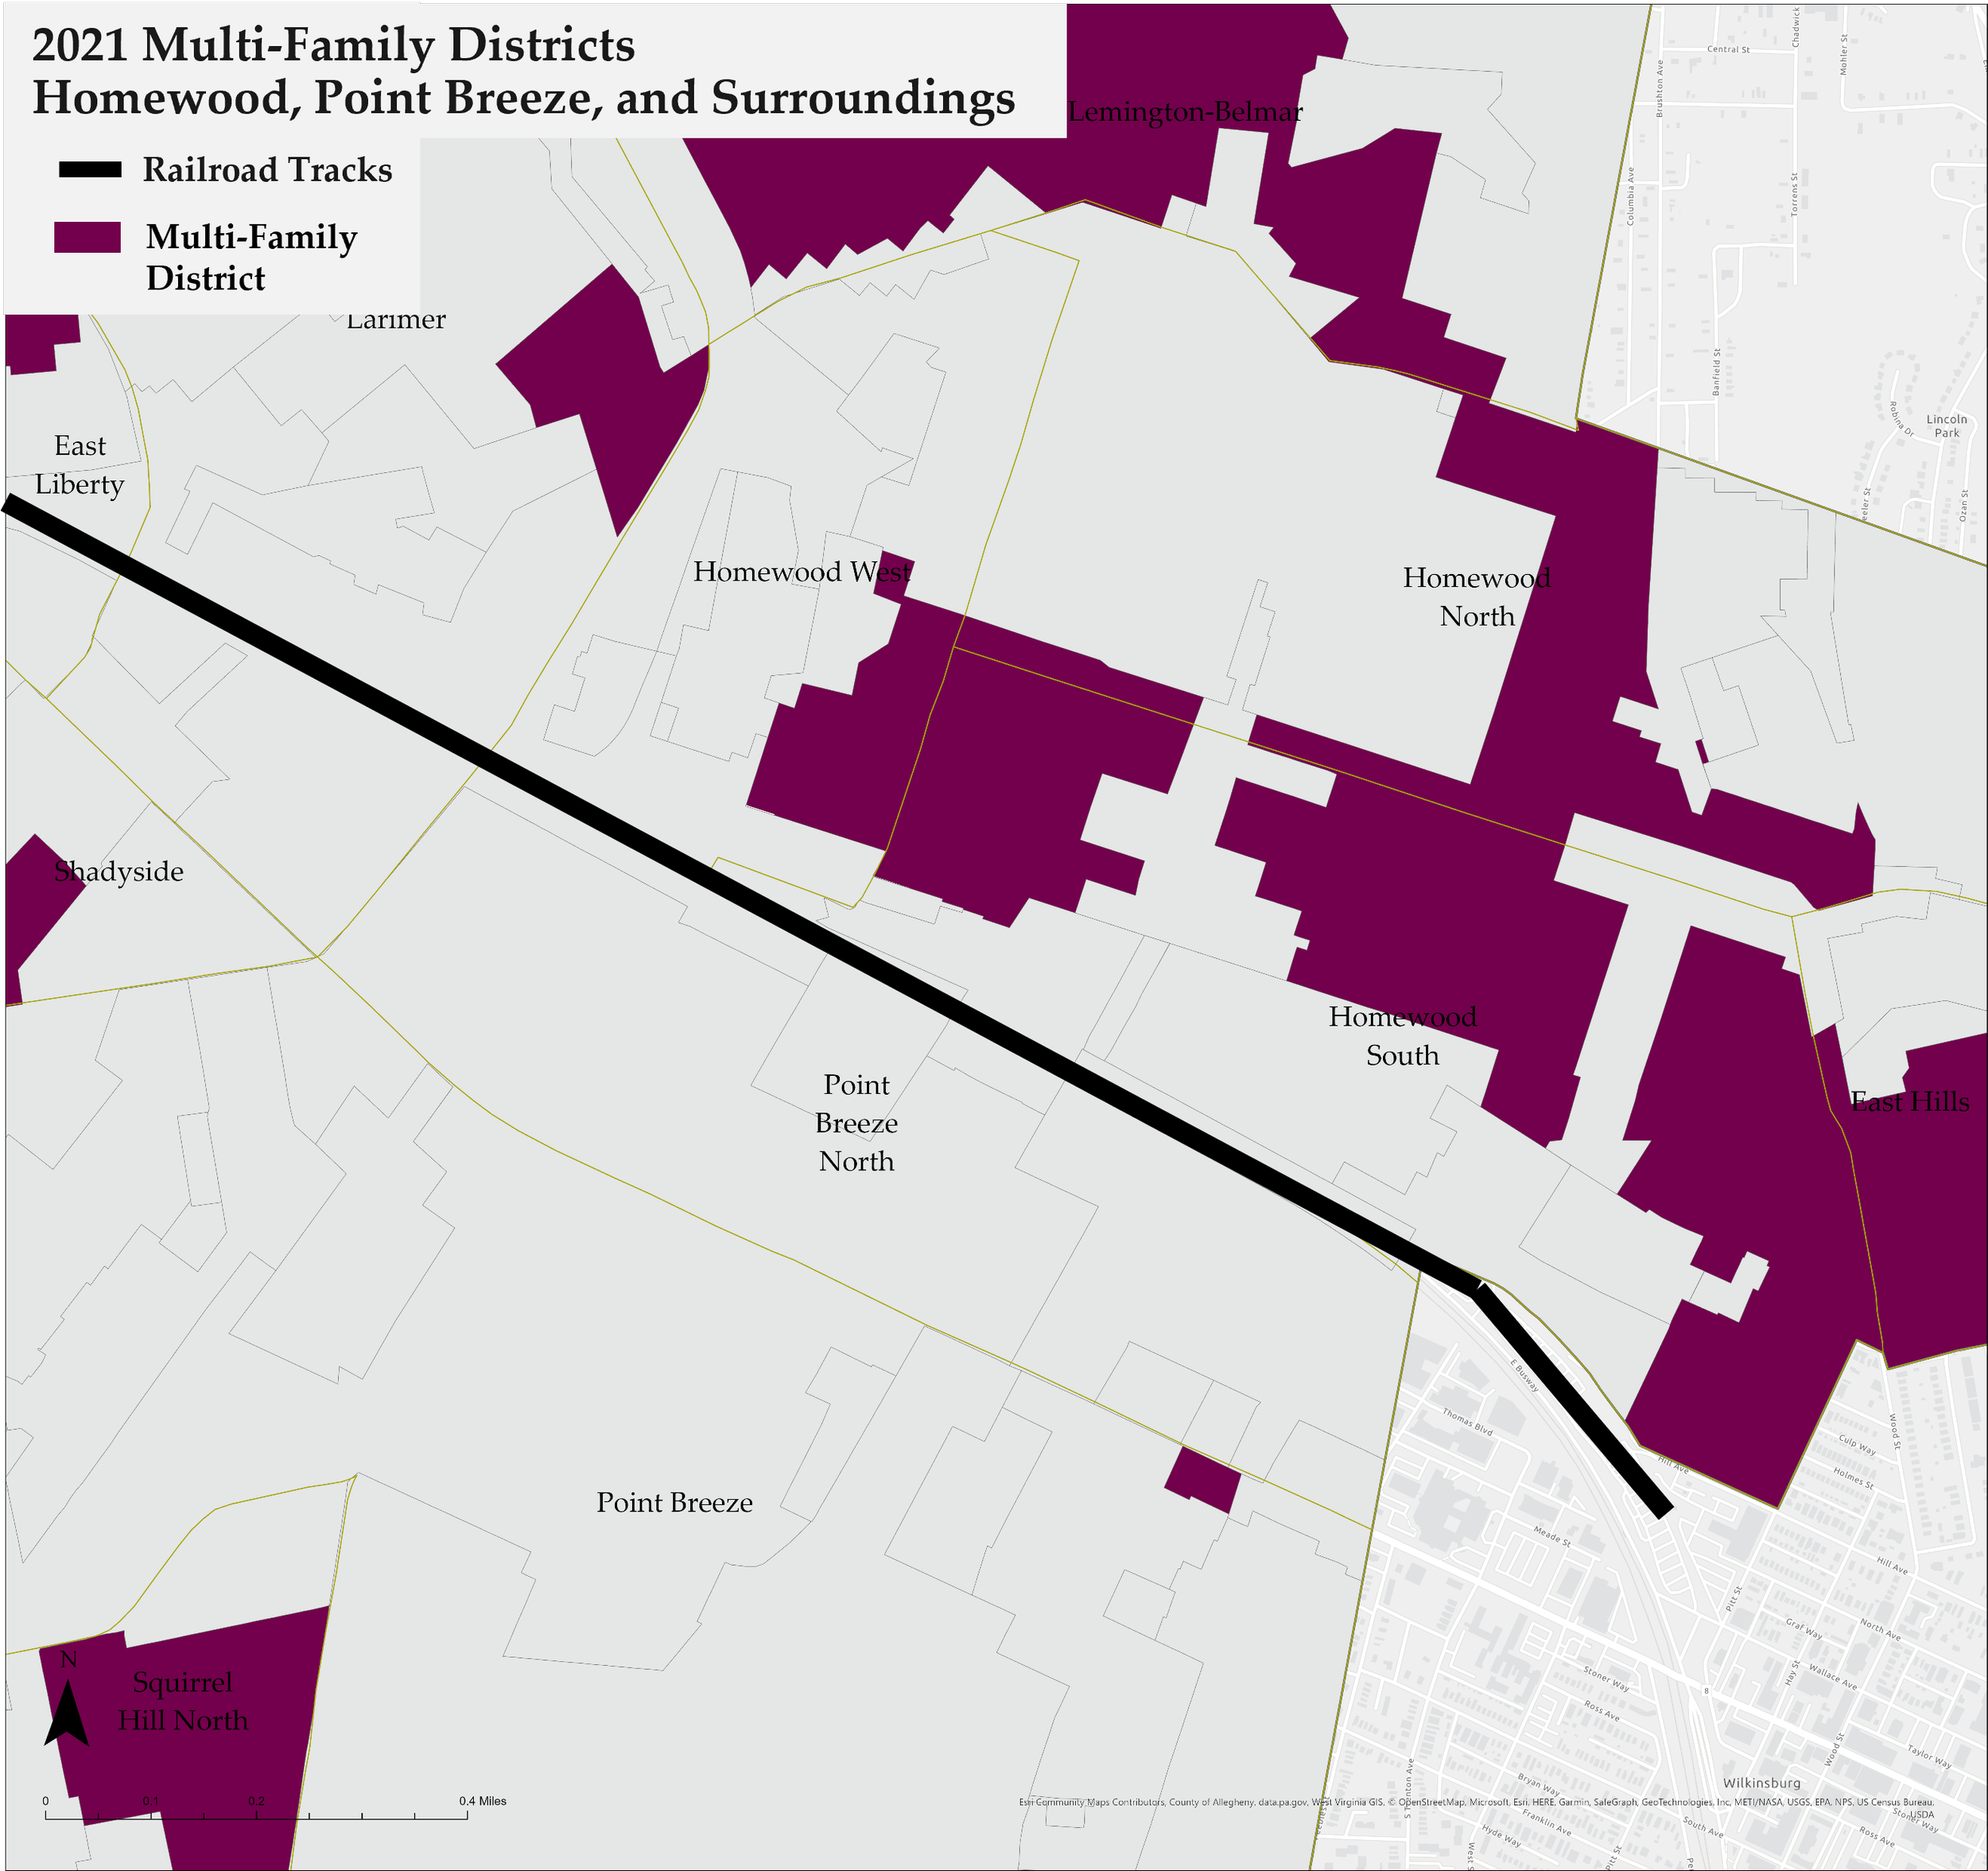
2021 Multi-Family Zoning Districts
Redlining in Multi-Family Zoning Districts 1927-2021
As the multi-family residential districts contract in the Homewood and Point Breeze neighborhoods, they are not only increasing located on the Homewood side of the railroad tracks, but also increasingly located in areas graded C “Definitely Declining” and D “Hazardous.”
-
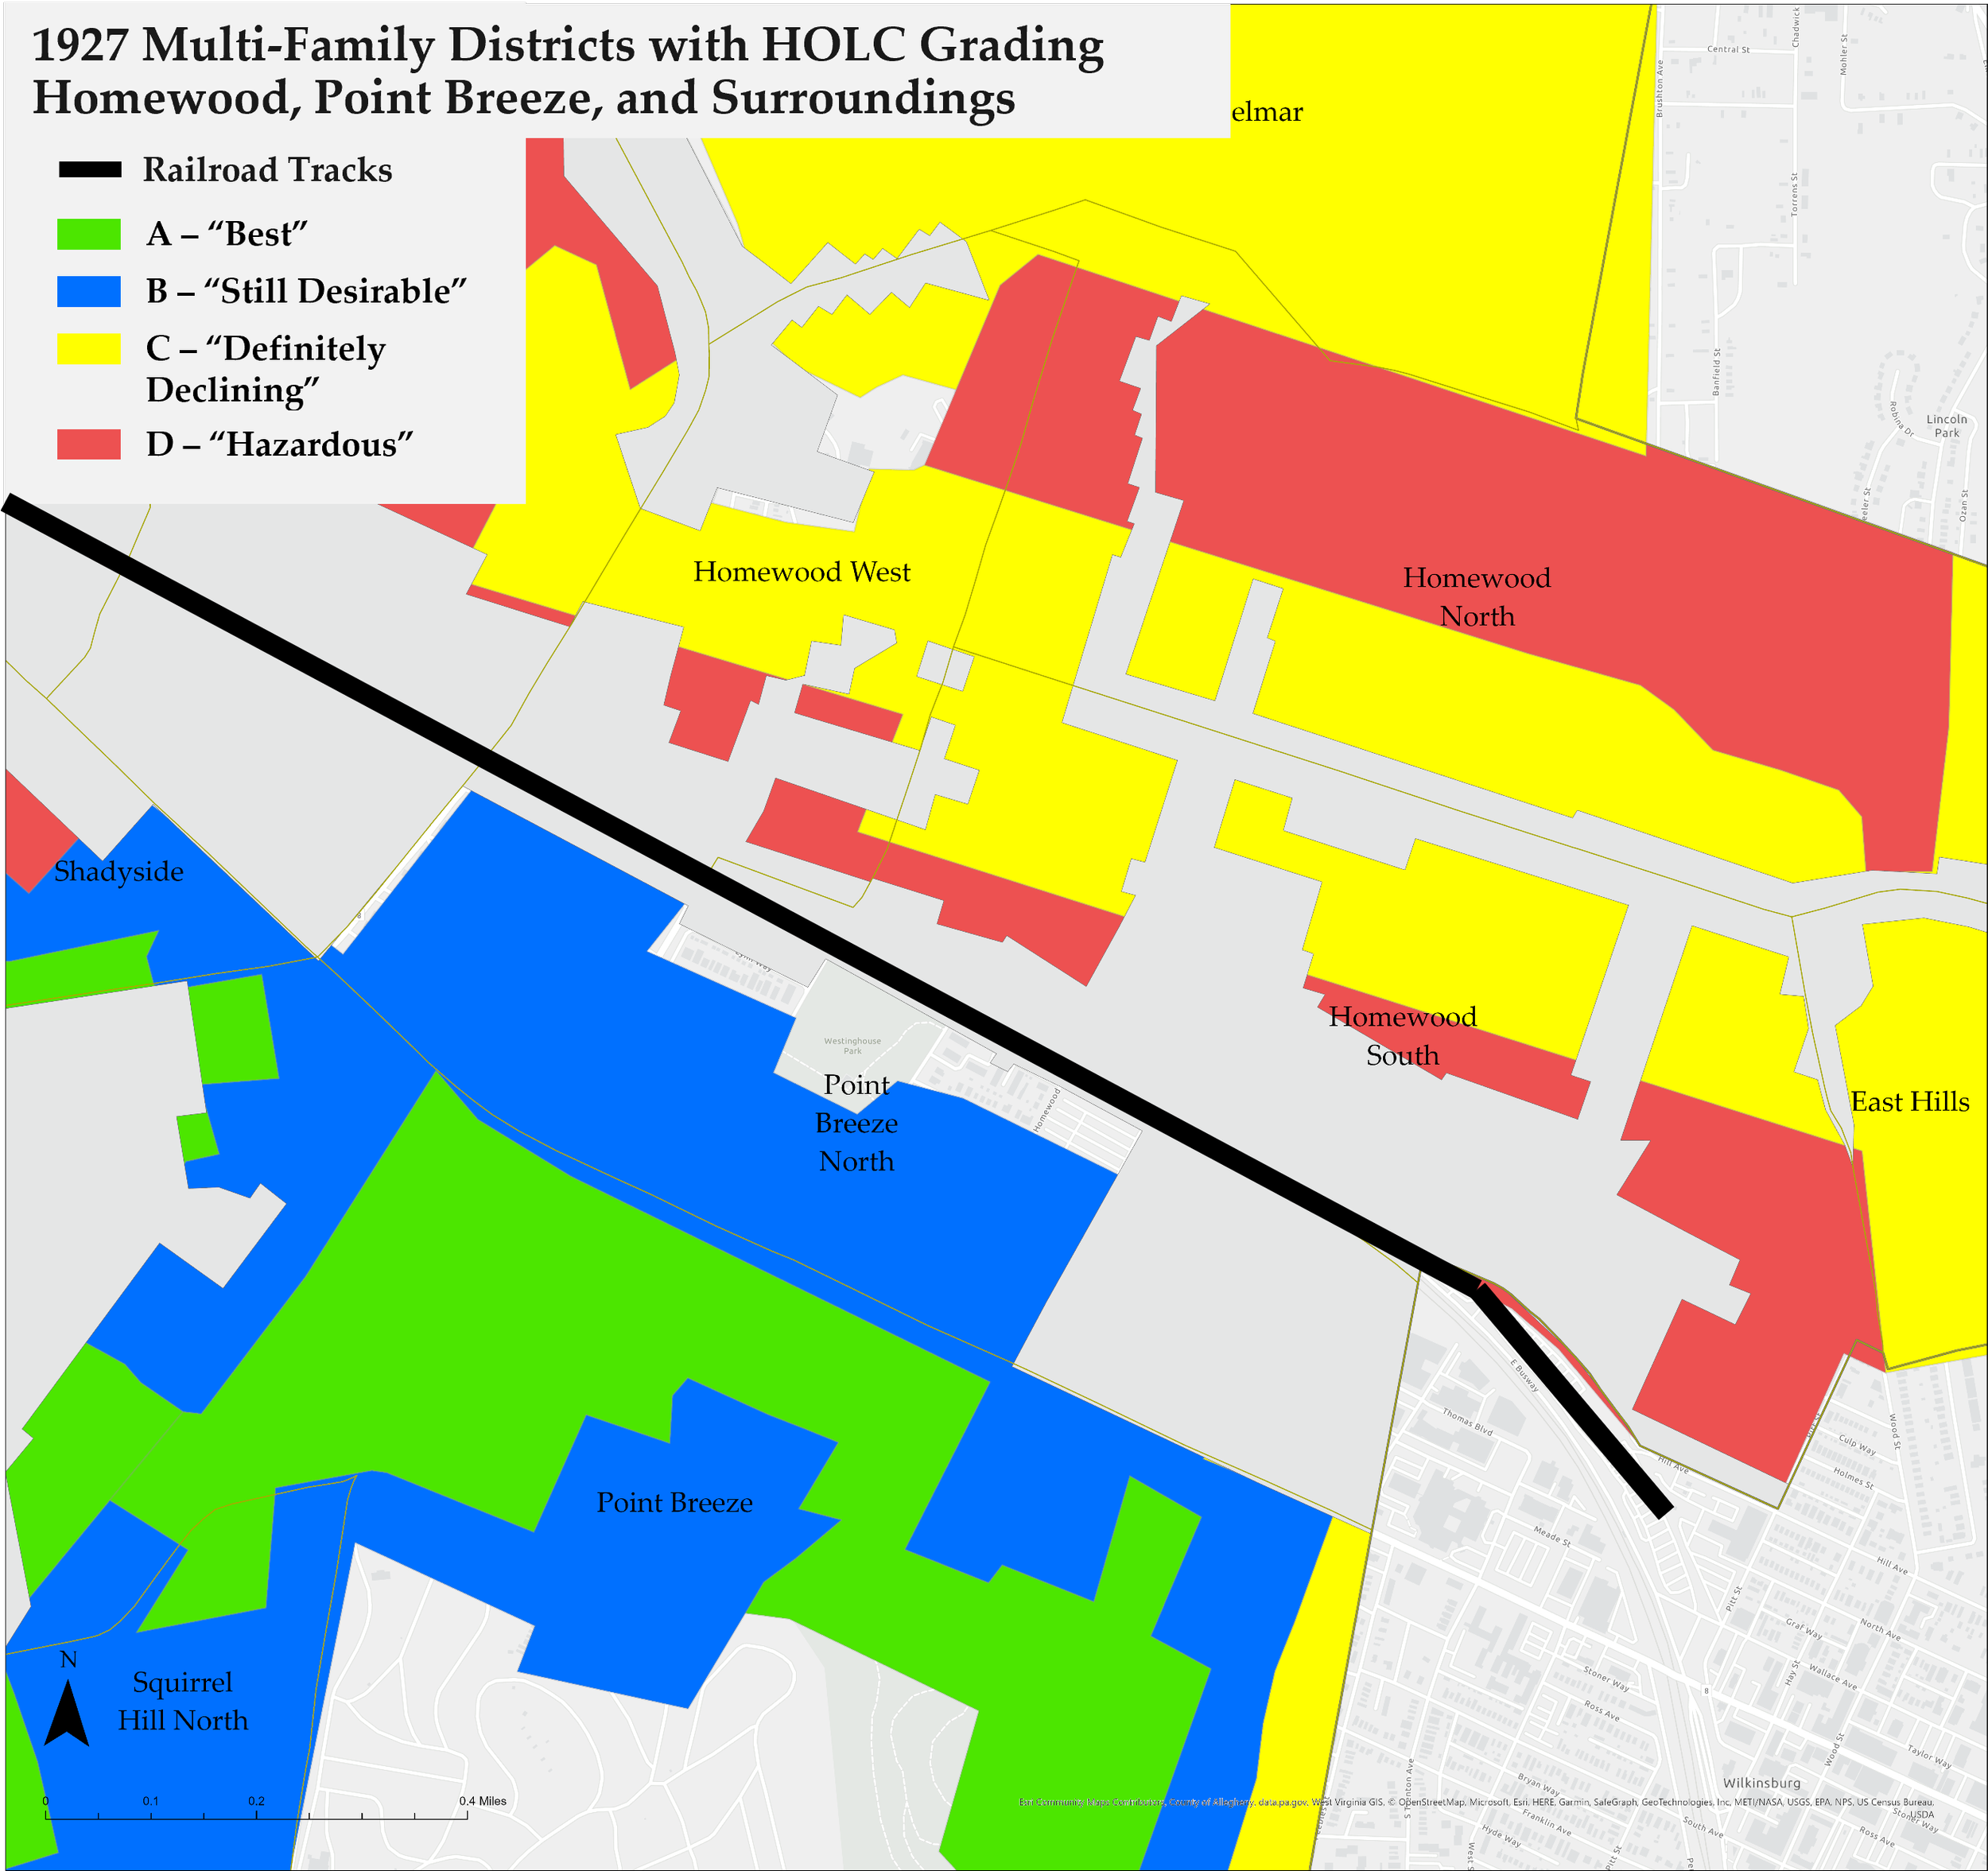
1927 Multi-Family Zoning Districts Redlining Grades
-

1967 Multi-Family Zoning Districts Redlining Grades
-

2021 Multi-Family Zoning Districts Redlining Grades
Race and Multi-Family Zoning Districts 1927-2021
As we saw with the city-wide trends, multi-family zoning districts are increasingly concentrated in areas with higher percentages of non-White residents by 2021. In the case study area, as the multi-family zoning districts shrank, they nearly disappeared south of the railroad tracks in the Point Breeze neighborhoods, but maintained a presence in the Homewood neighborhoods. At the same time, the residents of these areas of the Homewood neighborhoods became increasingly non-White. More specifically, residents in the Homewood neighborhoods are over 80% Black in the 2010 census.
A significant contributing factor in the shift in the demographics of the Homewood neighborhoods is that this area was one of the places that Black residents were permitted to relocate when forced out of their homes in the Lower Hill District in the 1950s and 1960s to make way for the Civic Arena and a sea of parking lots. It is beyond the scope of this research to determine if Black residents were pushed to Homewood because of the presence of the multi-family zoning districts or if the multi-family zoning districts continued in the Homewood neighborhoods because Black residents resided there. In either case, there is a correlation between the location of the multi-family zoning districts and Black residents.
The next section discusses some of the impacts on housing choice that this correlation creates.
-

1927 Multi-Family Zoning Districts Percent White Residents
-

1967 Multi-Family Zoning Districts Percent White Residents
-

2021 Multi-Family Zoning Districts Percent White Residents